
Truemed Geographic Health Index: Where You Live May Shape Your Health Spend
Author:Sinduja Rangarajan
Published:
October 16, 2026



1. For its size, no state pursues health like Utah
2. D.C. climbs, the Upper Midwest lifts, New York sweats together
3. A red light therapy belt runs through the high, dry, active West
4. In America’s frontier states, the signature health buy is a activity tracker for the trail
5. Therapeutic footwear is the South and Appalachia's signature health buy
6. Every city has a signature health buy: home gyms in El Paso, sleep in Boston, home monitors in Jersey City
Methodology
Citations:
Shop Eligible Products
Ready to unlock your HSA/FSA funds for qualified medical expenses?
1. For its size, no state pursues health like Utah
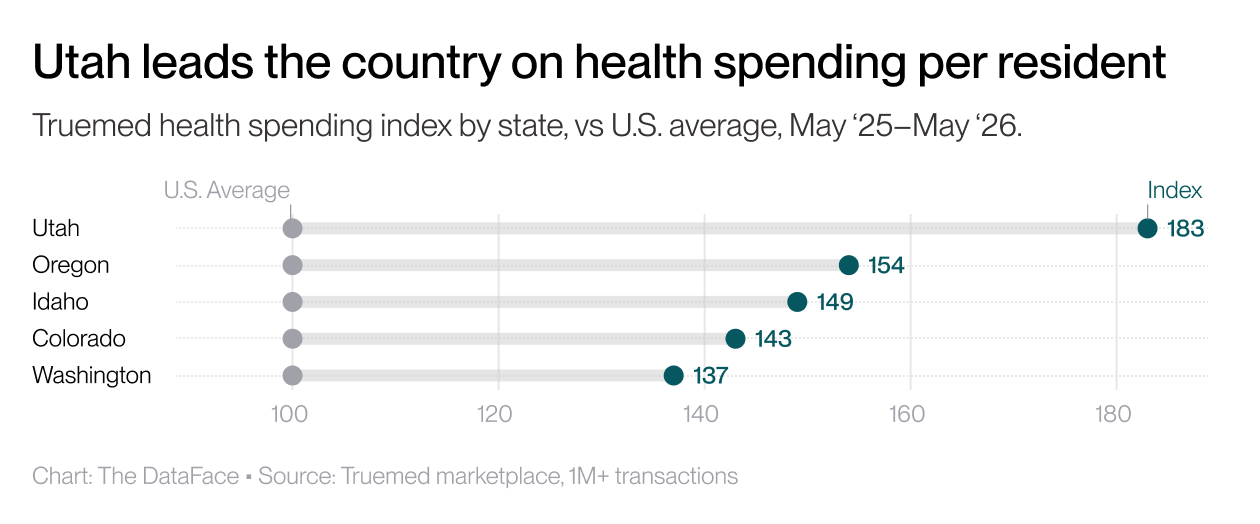
Adjusted for population, Utah turns pre-tax HSA/FSA dollars into health-related purchases at a higher rate than any other state.
- Utah leads the country on HSA/FSA purchases per resident on Truemed, roughly 80% above the national average. That means that if the average state makes 100 purchases per person, Utah makes roughly 180.
- Two forces plausibly explain Utah’s lead: First is health-engaged population: Utah is the youngest state in the country (median age 32.4 vs. 39+ nationally), among the most physically active, and a major hub of the supplement industry. The other is access: about 70% of Utah's private-sector workers were in HSA-eligible high-deductible plans in 2023, one of the highest rates nationally, so more Utahns hold pre-tax health dollars to spend.
- Utah has also become a focal point for traditional, homestead-style health and wellness, embodied by the state's own Ballerina Farm in Kamas, one of the most-followed expressions of the movement, a cultural current that fits a population already inclined to spend on health.
- Oregon, Colorado, Idaho, and Washington follow close behind, a tight Mountain West and Pacific Northwest cluster that all spend on health well above their size.
Truemed Geographic Health spending Index (U.S. average = 100, directional)
| State | Health activity Index | Rank |
|---|---|---|
| Utah | 183 | 1 |
| Oregon | 154 | 2 |
| Idaho | 149 | 3 |
| Colorado | 143 | 4 |
| Washington | 137 | 5 |
The youngest state spends young, too
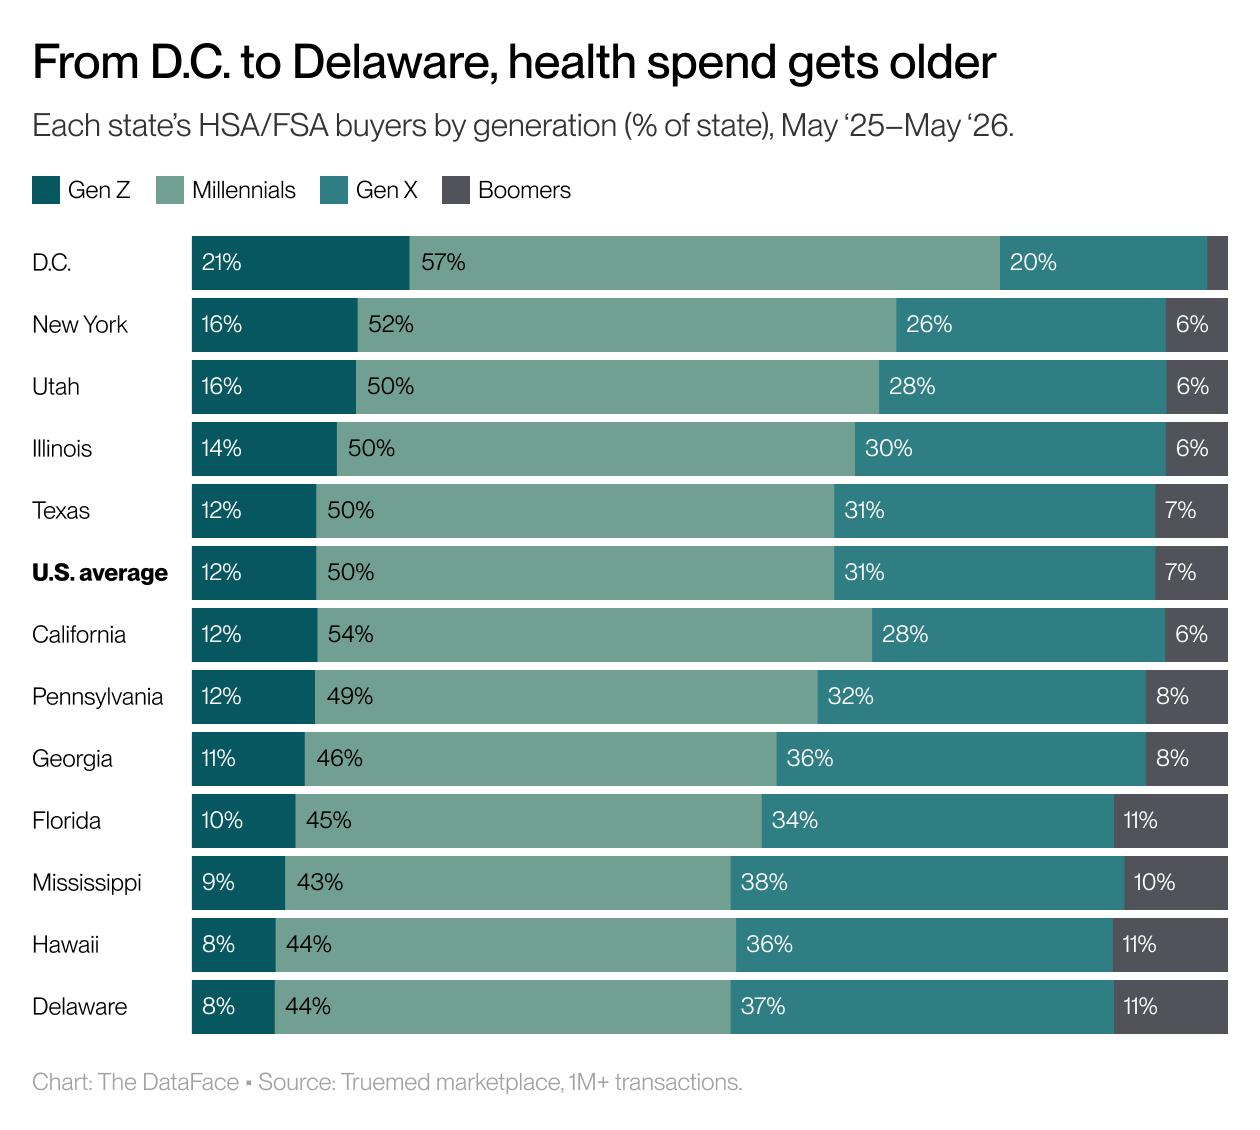
Utah's Gen Z makes up 15.7% of its HSA/FSA buyers on Truemed, well above the 12.2% national rate and behind only two urban magnets, New York (16.5%) and Washington, D.C. (20.9%).
2. D.C. climbs, the Upper Midwest lifts, New York sweats together
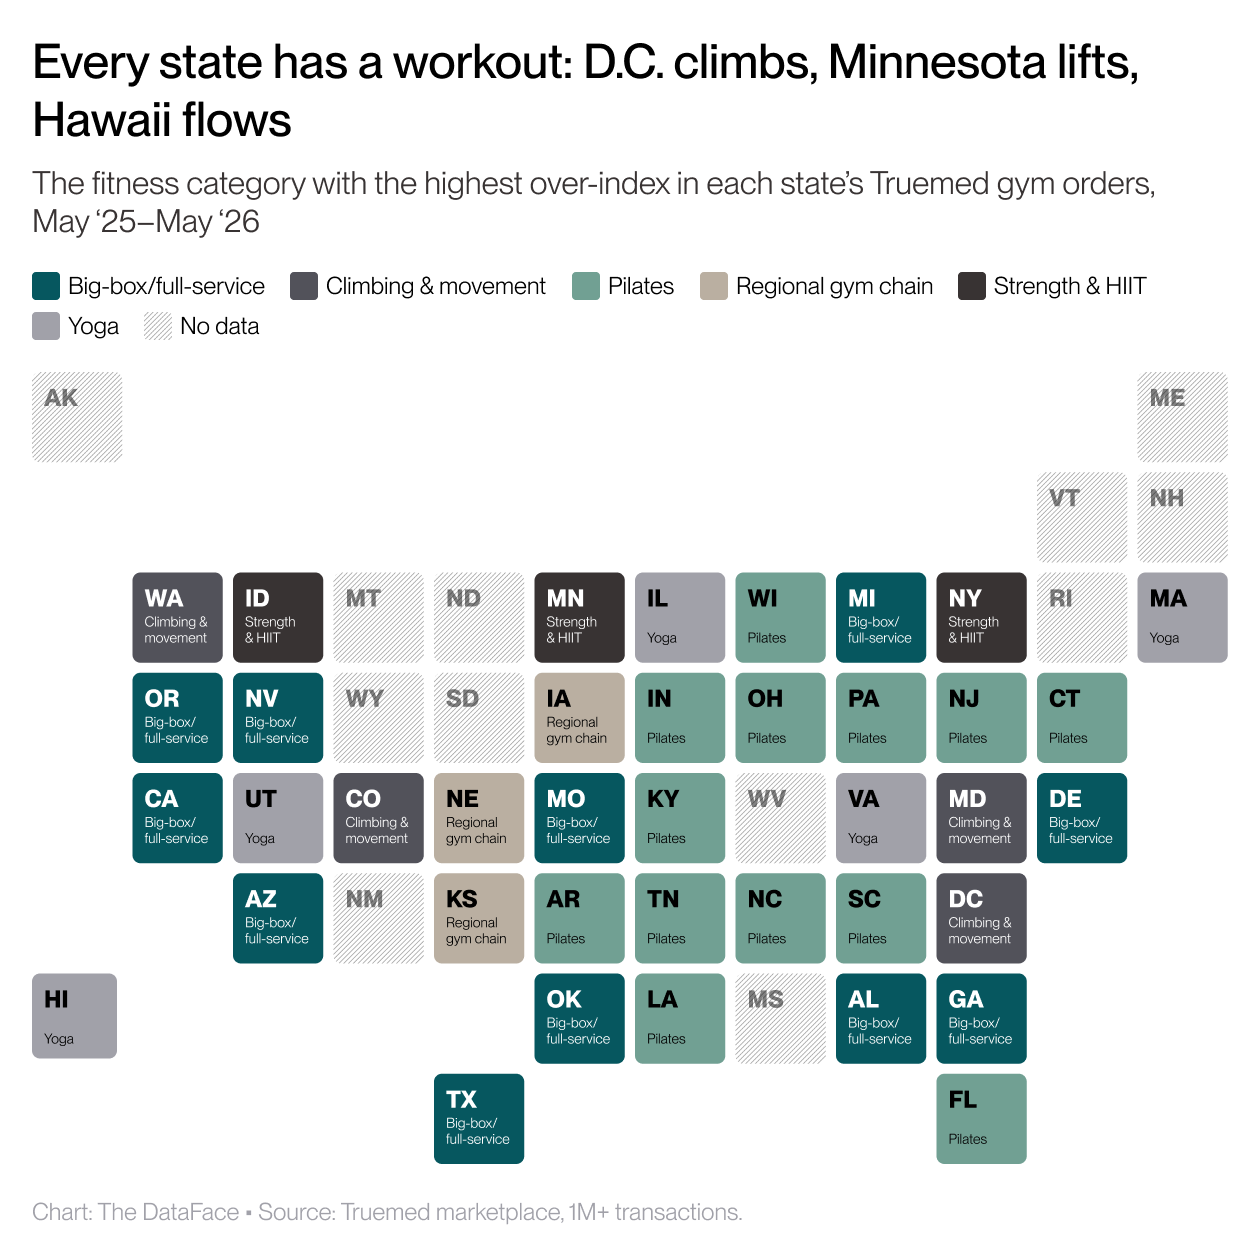
Fitness is where the map gets hyper-local, and how a city chooses to move is a window into how it expresses itself.
ClassPass is the dominant fitness purchase in about three of four states (29 out of 51), a single pass for many kinds of classes, but it doesn’t tell us which types of gyms are popular in which regions. Once we exclude ClassPass, we see distinct patterns of exercise by region.
- Climbing defines the capital and the coast. The Bouldering Project over-indexes about 12x in Washington, D.C. and 7x in Washington State, and climbing-and-movement gyms over-index in Colorado and Maryland (Movement Gyms, ~3x).
- The Upper Midwest lifts. Minnesota's most distinctive gym is a strength studio, Discover Strength (~24x). Idaho leans CrossFit and New York leans Barry's and SoulCycle, the sweat-it-out boutique end.
- The Plains run on one homegrown chain. Power Life dominates Iowa, Nebraska, and Kansas (30–65x), a popular regional chain.
- Yoga is a Hawaii and Illinois signature (CorePower).
- Most of the South and Sun Belt default to big full-service chains (Life Time), and the West Coast to 24 Hour Fitness.
| Workout | Brand(s) | Over-indexes in |
|---|---|---|
| Climbing & movement | The Bouldering Project, Movement Gyms | D.C., Washington; Colorado, Maryland |
| Strength & HIIT | Discover Strength, CrossFit, Barry's | Minnesota; Idaho; New York |
| Yoga | CorePower | Hawaii, Illinois (also MA, UT, VA) |
| Pilates | Club Pilates | Kentucky + much of the South and East |
| Regional gym chain | Power Life | Iowa, Nebraska, Kansas |
| Big-box / full-service | Life Time, 24 Hour Fitness | South & Southwest; California, Oregon |
| Aggregator (set aside) | ClassPass | #1 by share in 29 of 51 states; over-indexes nowhere |
3. A red light therapy belt runs through the high, dry, active West
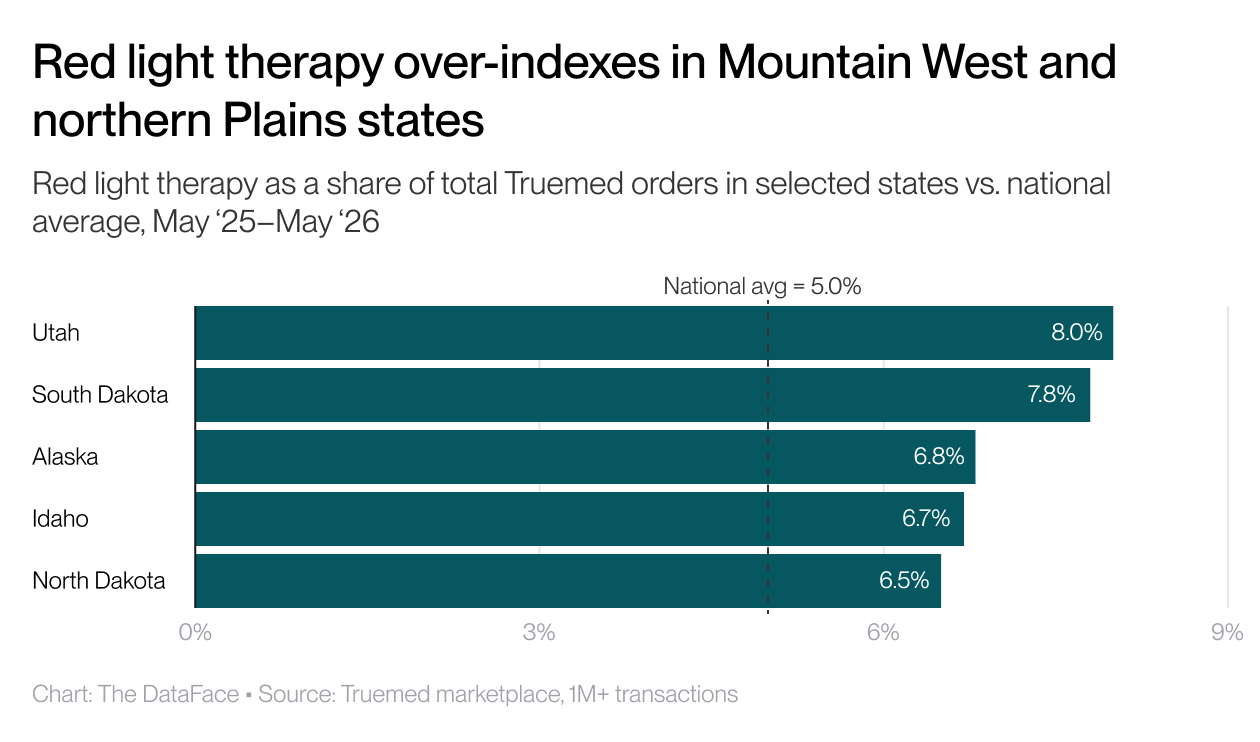
A belt of states from Utah up through the Mountain West and northern Plains buys red light therapy well above the national rate, and the pattern follows altitude, sun, and an active outdoor lifestyle.
- Utah and South Dakota lead, both near 8% of FSA/HSA orders, with Alaska, Idaho, and North Dakota close behind.
- The belt concentrates in high-altitude, sun-intense, dry states with active, outdoors-oriented populations.
- Medical evidence for red light therapy shows that it is beneficial for skin health and collagen (relevant in high-UV, high-altitude environments where people focus on sun damage), accelerates wound healing (such as diabetic ulcers or slow-healing injuries)and muscle recovery and inflammation (relevant for an active population).
4. In America’s frontier states, the signature health buy is a activity tracker for the trail
Across the most remote, wide-open western frontier states — Alaska, Montana, Idaho, Wyoming, and the Dakotas — devices, fitness and activity trackers, and wearables over-index.
- These are among the most outdoors-active states in the country — Alaska, Montana, and Wyoming rank in the top five for outdoor recreation as a share of their economy according to the Bureau of Economic Analysis
- The top sellers are activity trackers, GPS sport watches and recovery gear: the equipment of trail runners, mountaineers, backcountry skiers, and cyclists. Garmin leads by a wide margin, with COROS close behind.
- It's health tech that people use to track their fitness, see how their bodies respond to altitude and exertion, and recover from hard days outdoors.The pattern fits both how these states stay healthy (active, self-directed, built around the outdoors) and their circumstances: remote and rural regions of America are heavily underserved by in-person care — roughly 80% of it is medically underserved, and over 90% of Montana's counties are designated health-professional shortage areas — so self-managed, device-based health does the job.
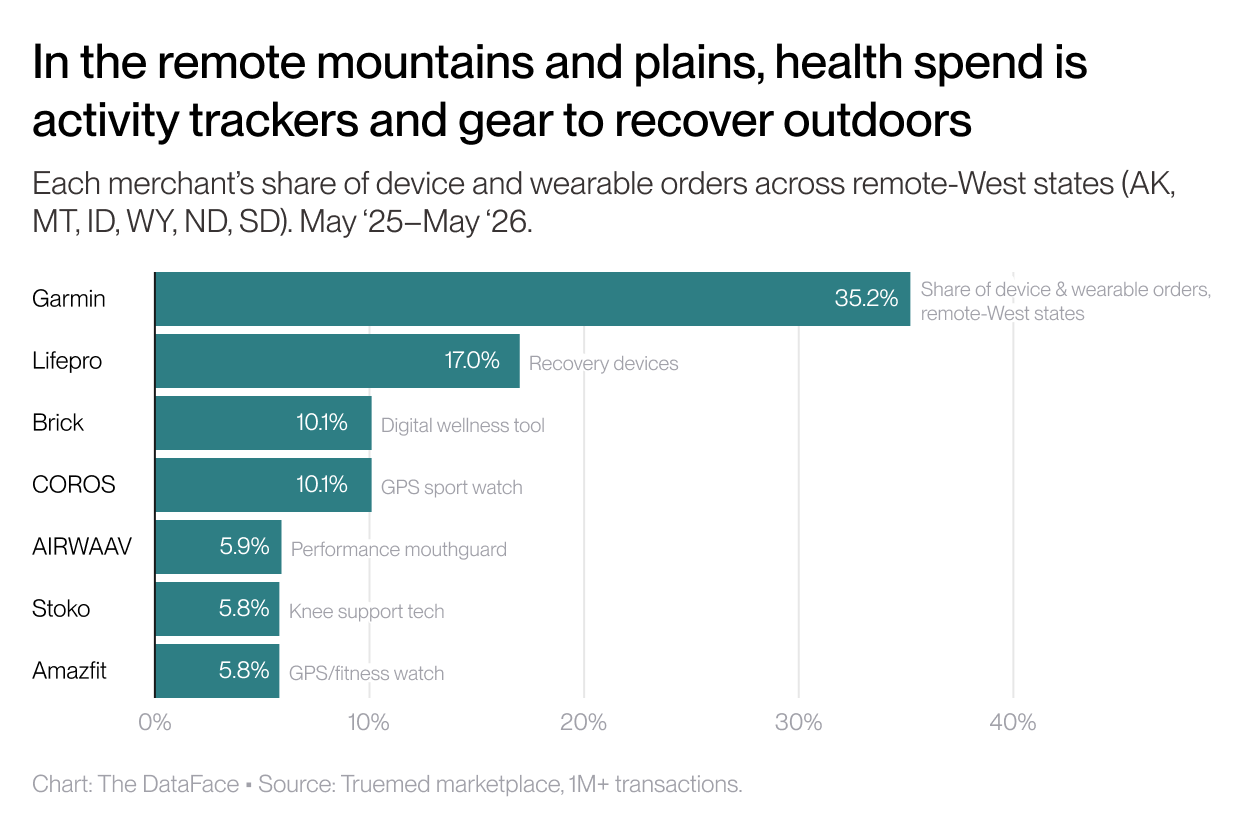
Region = the remote West: Alaska, Montana, Idaho, Wyoming, North Dakota, and South Dakota. Rank is each brand's standing among health-tech merchants pooled across those states.
5. Therapeutic footwear is the South and Appalachia's signature health buy
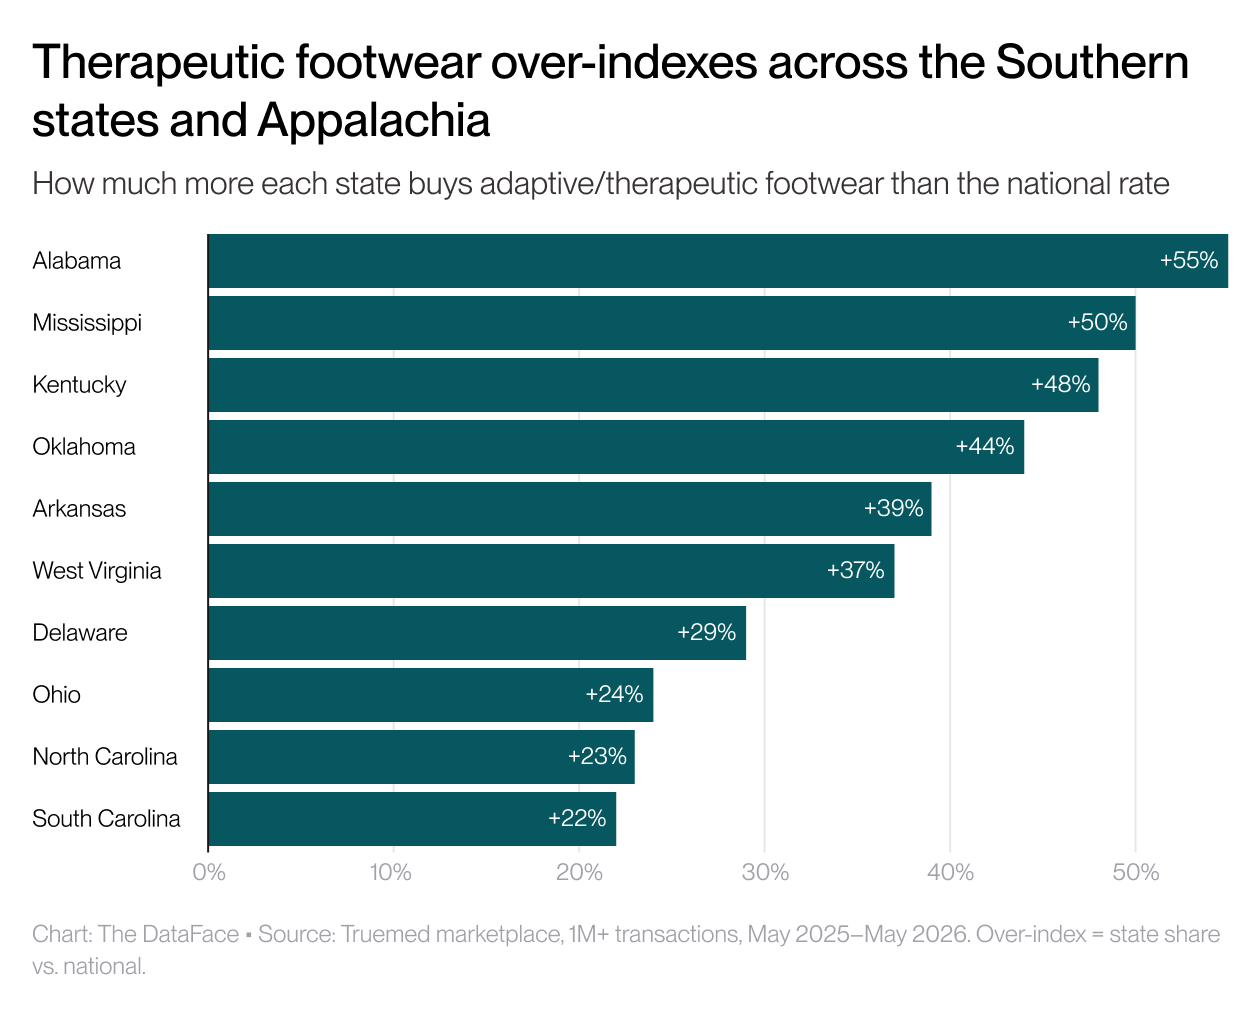
Therapeutic footwear is a real problem-solver: shoes built for diabetic foot care, circulation, neuropathy and mobility.
- In Truemed's data, demand skews toward the South, Appalachia, and parts of the Midwest, with the strongest preferences in states such as Alabama, Mississippi, Kentucky, Oklahoma, and Arkansas.
- According to CDC data, diabetes and foot-health conditions correlate at higher rates in these regions.
- The merchants are Orthofeet across the Mid-Atlantic and Midwest, Flux Footwear in the Deep South, G-defy in Mississippi.
- The is a story of access: these are purchases that families might otherwise delay, made affordable through pre-tax health dollars, the medically approved essentials that improve daily life.
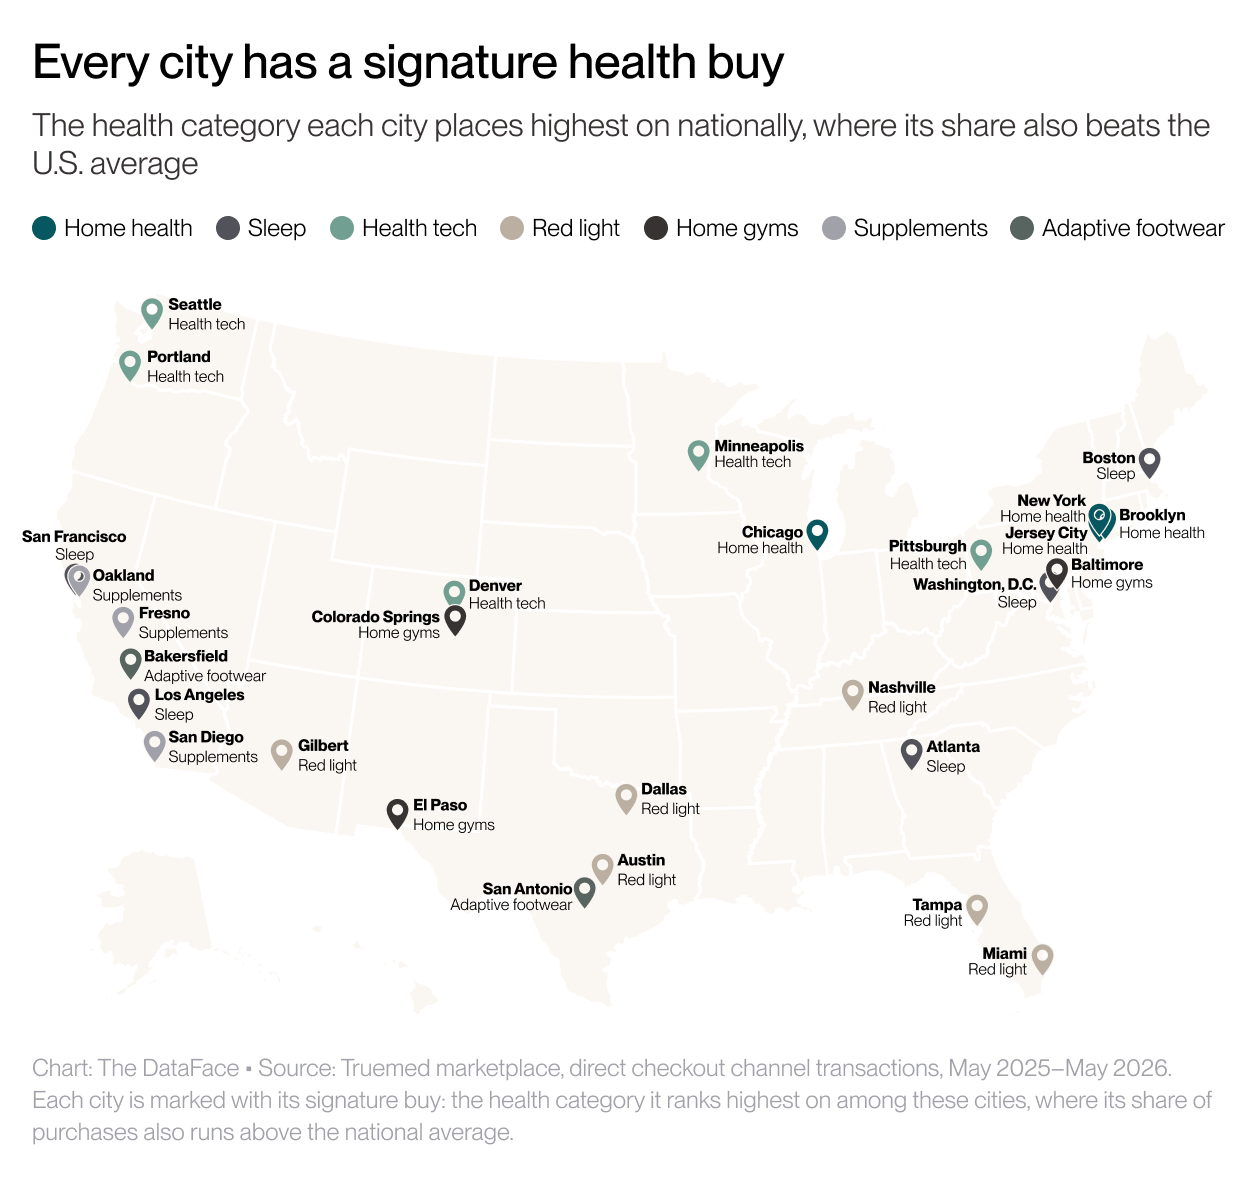
6. Every city has a signature health buy: home gyms in El Paso, sleep in Boston, home monitors in Jersey City
Zoom into the 50 largest cities and each one has it’s own character
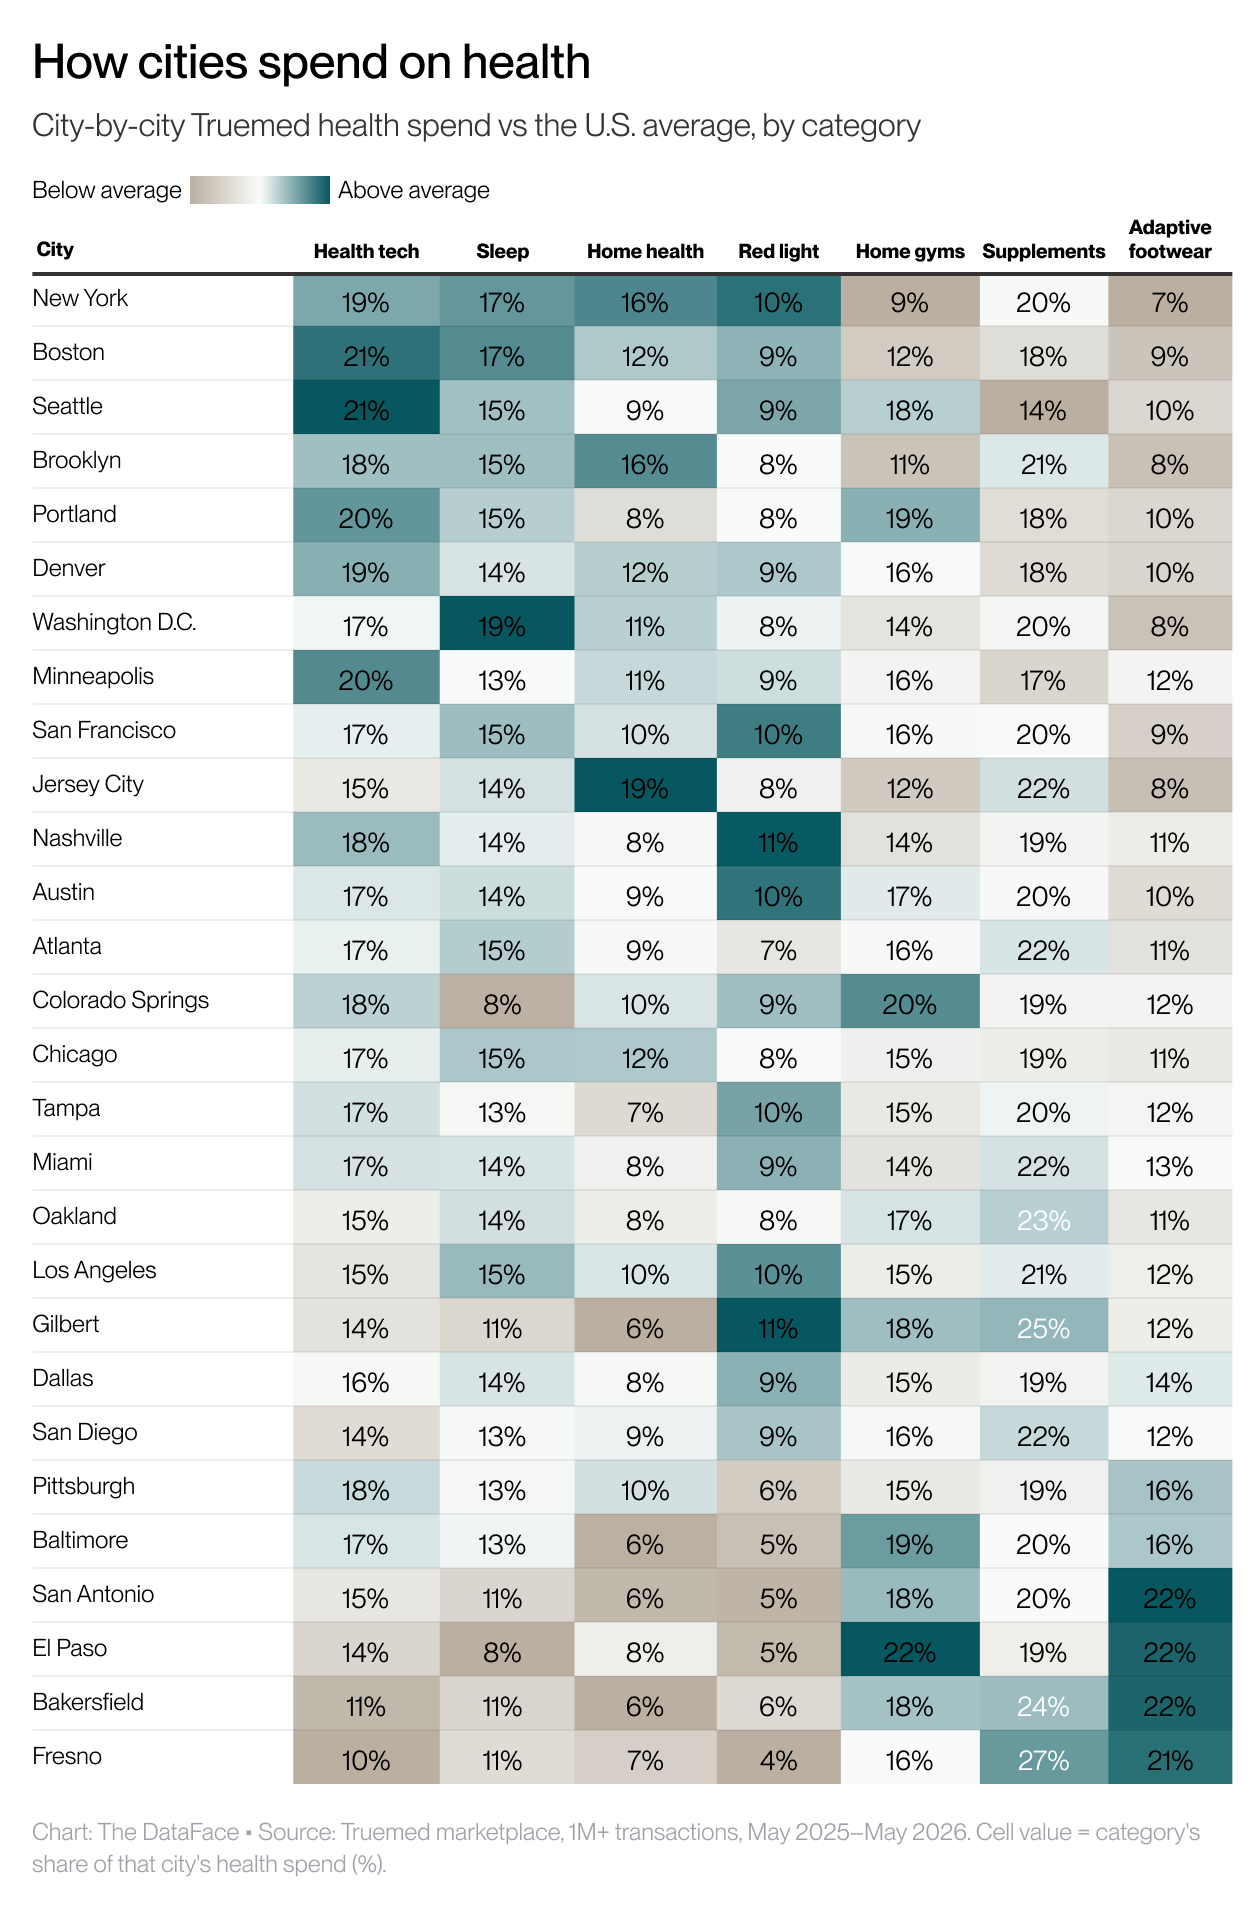
- El Paso and Colorado Springs are the home-gym capitals. Fitness equipment is 21.6% of El Paso's health spend and 19.9% of Colorado Springs', a heavy military town full of young, active residents. El Paso is the only city in the top 50 to over-index on both fitness equipment and therapeutic footwear. Dense cities with no room for a home gym, like New York, Boston, and Brooklyn, sit at the bottom.
- Jersey City buys more at-home medical gear than any city in the country. Home health, the category covering monitoring devices, therapeutic equipment, and recovery tools used at home, makes up 19.3% of Jersey City's health spend, more than double the national rate and the single biggest over-index in the data. With New York (16.1%) and Brooklyn (15.8%) close behind, the NYC metro clearly has a home-health pattern all its own.
- Boston and D.C., lead on sleep. Boston (17.0%) and D.C. (18.8%) top the list. Los Angeles, San Francisco, and Atlanta round out the cities whose signature buy is sleep.
- The country's tech hubs also buy the most health tech. Seattle, Minneapolis, and Portland lead on health tech, the Truemed category for fitness and activity trackers, smart rings & watches, and monitors, with Seattle out front at 21.4%, the highest of any large city. Where tech talent clusters, so does health tracking.
- Red light therapy is a Sun Belt suburb story. Red light therapy is a Sun Belt story. Gilbert, in the Phoenix suburbs, buys red light at the highest rate of any large city (about 10.5% of health spend versus 7.5% nationally), and it's the signature buy across a Southern band of cities: Nashville, Austin, Dallas, Tampa, and Miami.
- Nashville breaks its region's mold. It's the only large Southern city that buys health devices like Seattle or Denver, ranking high on both health tech and red light therapy. Nashville is the South's standout for this kind of health spend.
Methodology
This analysis covers more than 1.2 million completed HSA and FSA transactions on Truemed's preventive-health marketplace, placed across all 50 states and Washington, D.C. between May 2025 and May 2026.
Truemed helps people put pre-tax HSA/FSA dollars toward health in every state, which gives us an unusual view into not just what Americans buy to feel better, but where.
All data is aggregated and anonymized at the state, generation, and gender level. Age and gender are self-reported at the qualification step in Truemed's intake process. Truemed sees orders placed on the platform with HSA and FSA dollars, not a buyer's full HSA balance or purchases made outside the marketplace. Figures in this story are shares, indices, and percentages, not raw transaction counts.
City figures come from Truemed's data from use direct-checkout channels which covers hundreds of thousands of records. For this analysis, we used the top 50 largest cities by transactions.
Generations
- Gen Z: 18 to 29
- Millennials: 30 to 45
- Gen X: 46 to 61
- Boomers: 62 and older
How to read the numbers
- Share = a state's (or generation's) transactions in a category or brand ÷ that state's (or generation's) total transactions in the window. This is what we mean when we call a category or brand a state's most popular, or say a generation makes up a given share of its buyers.
- Health Spending Index = HSA/FSA activity per resident, indexed so the U.S. average = 100. State rates are adjusted for population using U.S. Census Bureau Vintage 2024 estimates. The index is directional.
- Over-index = how concentrated a brand or category is in a state relative to its national footprint: (state share − national share) ÷ national share. A brand that over-indexes 3x appears three times as often in that state's orders as it does nationally. We apply a minimum-share floor so a brand with only a handful of transactions can't post a large but meaningless over-index.
Citations:
Data and Population
U.S. Census Bureau, Vintage 2024 National and State Population Estimates
HSA/FSA access
ValuePenguin, High-Deductible Health Plan Enrollment Study
Utah: demographics and activity
KSL, Utah Retains Title as Youngest State in the Nation
Utah Department of Health, IBIS-PH, Physical Activity Among Adults
Red light therapy
University of Utah Health, Red Light Therapy: Just a Fad?
Harvard Health, Red Light Therapy for Skin Care
Diabetes and foot health
CDC, Diabetes Data and Statistics
Written by the Truemed Brand & Insights team.


See what you can do with your HSA/FSA.
Join 1.5 million Americans who have routed their healthcare dollars toward root cause health via Truemed's HSA/FSA marketplace.
New product announcements
Sales and special offers
Tips for utilizing your HSA/FSA
Editorial Standards
At True Medicine, Inc., we believe better health starts with trusted information. Our mission is to empower readers with accurate and accessible content grounded in peer-reviewed research, expert insight, and clinical guidance to make smarter health decisions. Every article is written or reviewed by qualified professionals and updated regularly to reflect the latest evidence. For more details on our rigorous editorial process, see here.